Insurance and the Rebuilding of Ukraine: What the Market is Ready to Cover Today
Overview of insurers’ interest, limitations, and coverage of war risks based on the NASU interactive dashboard data.
Why this overview
Ukraine is on the threshold of a massive national recovery process. Preparation for the deployment of large-scale infrastructure, industrial, and social projects is already shifting from strategic discussions to practical planning. Attracting significant investments, donor funds, and private capital into the economy is objectively impossible without reliable risk management tools. Insurance plays the role of a fundamental safeguard in this process, ensuring financial stability and asset protection during the rebuilding.
That is why the main goal of this overview is to provide all stakeholders—the state, consumers, local businesses, and potential foreign investors—with the most objective and transparent picture of the domestic insurance market’s readiness to support recovery projects. We aim to clearly define the current risk appetite of companies, show which sectors can already rely on full protection today, and frankly highlight the key barriers, limitations, and risk zones that currently require additional state or international guarantees.
The basis for this analytical product is the results of a large-scale survey on products for recovery, developed by NASU (National Association of Insurers of Ukraine) taking into account the criteria of the Ukraine Recovery and Reconstruction Framework (URC), as well as the priorities of the EBRD, the World Bank, and the European Commission.
The collected data is highly representative, as the survey involved 17 participating companies of the NASU PDMA project (Project of Information Disclosure, Monitoring, and Analysis), of which 4 are life insurance companies and 13 are non-life insurers. Based on the results of 2025, this sample collectively accounts for 65% of all premiums in the Ukrainian insurance market.
The implementation of recovery projects requires investors and businesses to have a clear understanding of the existing risks. To make informed decisions, they need quick access to up-to-date data. Understanding this, the National Association of Insurers of Ukraine (NASU) made a fundamental decision: not to create yet another flat, multi-page report where searching for information is long and inconvenient. Instead, given the need for prompt and modern analytics, we have developed a special interactive dashboard based on the Power BI platform.
This tool makes insurance market data open and easy to analyze. It allows everyone to move away from standard reports and independently model their own scenarios. Thanks to cross-filtering, you can see the whole picture in one click—from the general interest of insurers in a particular industry to the analysis of deductibles and limits in specific regions. In fact, it is a convenient navigator for investors, instantly showing where insurance is fully available and where limitations apply.
Key Takeaways in Two Minutes
- Classic risks – no problem. Construction, agriculture, healthcare, and most “peaceful” sectors can already obtain full insurance coverage today.
- War risks – a bottleneck. Only 31% of companies are ready to develop products covering damages from missiles, drones, or debris. The reason is simple: insurance relies on predictability, while war damages are unpredictable and can occur simultaneously for many clients.
- Three main stop-factors: proximity to the frontline, proximity to critical infrastructure facilities, and the objectively high cost of such coverage.
- The key to scaling – international reinsurance. The domestic capabilities of Ukrainian companies are limited, so large projects require the participation of the global market and state or international guarantees.
Which Sectors Are Insured Willingly and Which Are Not
Excluding war risks, the market’s priorities are clear. Insurers show the greatest openness to real estate and construction (50% of companies have a broad appetite), healthcare (40%), and the agri-food sector (34%). This is a positive signal for investors in civil infrastructure and the food industry.
The situation is more complicated in strategic sectors. Energy and critical materials (mining and processing) received only a 25% broad appetite, and over a third of insurers have either completely closed these areas or introduced strict limits. This is a direct consequence of systematic attacks on such facilities. Without state or international guarantees, companies are not ready to retain these risks on their own balance sheets.
The dashboard allows you to see this clearly: if you select the “Energy” sector, the risk rejection rate instantly jumps to 78.9%.
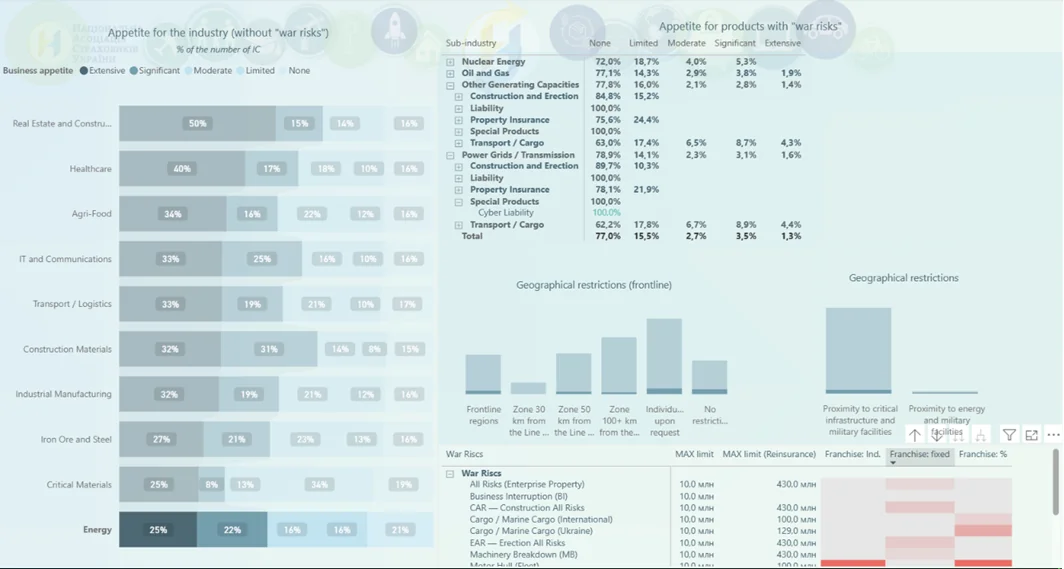
Fig. 1. Interactive data slice (cross-filtering)
War Risks. What Can Actually Be Insured
In global practice, the coverage of war and political threats has three levels – from basic to the broadest:
Type of coverage | What it covers |
WRI (War Risk Insurance) | Damages from missiles, drones, air defense systems and their debris, as well as fires, explosions, and shock waves resulting from such strikes. |
PVI (Political Violence Insurance) | Everything included in WRI, plus terrorism and sabotage, strikes, riots, civil commotion (SRCC), war and civil war, coups, and rebellions. |
PRI (Political Risk Insurance) | Everything included in PVI, plus expropriation of assets, currency restrictions (ban on conversion or capital export), and default on obligations by state entities. |
An important feature of the Ukrainian market is that classic PVI coverage in its full global sense is currently almost unavailable here. Instead, companies offer a hybrid “WRI+” format – basic war risk insurance to which specific PVI coverage elements are carefully and selectively added.
The greatest expertise in war risks is accumulated in motor insurance (CASCO) and classic property insurance. A cautious interest is emerging in construction and erection all risks (CAR/EAR) and even business interruption (BI) insurance. At the same time, energy remains a “red zone”: 78.9% of companies do not insure power grids, 77.1% – the oil and gas sector, and 72% refuse to cover nuclear energy, airports, and railway rolling stock.
Geography. Distance to the Frontline Decides Everything
Insurers apply a strict spatial approach – the closer to the frontline, the lower the chances of obtaining coverage. Frontline territories and the zone up to 30 km from the front are not considered at all. Noticeable easing of conditions begins only at a distance of 50 km, and more comprehensive coverage from 100+ km.
Even in rear regions, a critical stop-factor is the proximity of the object to energy or other critical infrastructure. Proximity to a potential attack target can be a reason for refusing to conclude a contract.
How Much the Market is Ready to Cover. Limits and Deductibles
The key indicator here is net retention – the maximum loss amount that a Ukrainian company is ready to pay out independently from its own reserves, without transferring the risk to international partners. For basic war risks, this limit remains at the level of UAH 10 million, and for the expanded “WRI+” package, it drops to UAH 5 million – precisely because of the unpredictability of such threats. A notable exception is the insurance of international cargo transportation (Cargo), where conditions are more flexible.
Practical conclusion: Losses exceeding these amounts can only be covered by involving the international reinsurance market. Reinsurance is the only factor capable of radically increasing Ukraine’s insurance capacity.
The situation with deductibles – the portion of the loss covered by the client themselves – is also indicative. For war risks, the market applies the strictest deductibles, both fixed and percentage-based, for the vast majority of property and construction objects. The hardest thing is to get full business interruption (BI) protection – the barriers here are the highest.
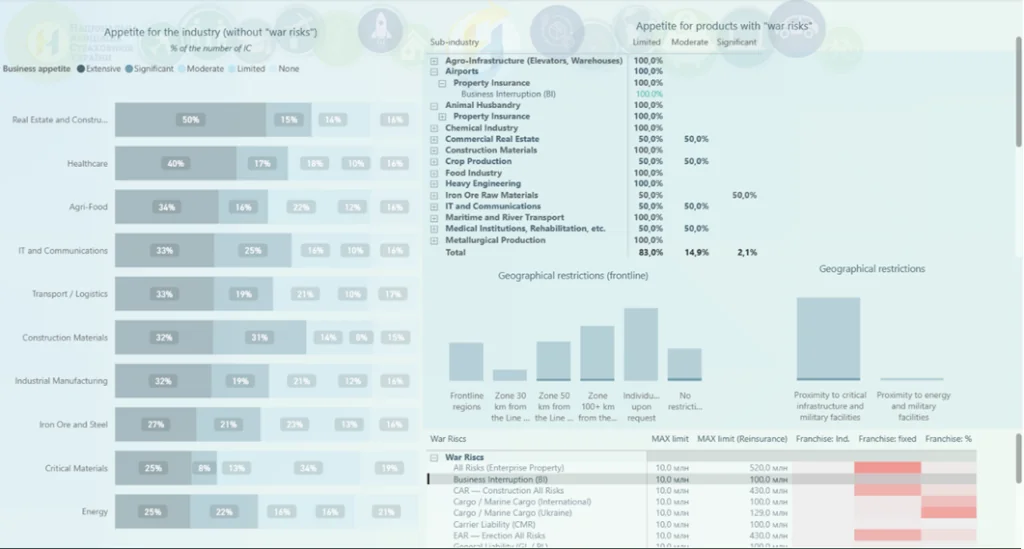
Fig. 2. Focus on a specific risk
Insuring People. Health, Accidents, Life
Protecting employees is a mandatory component of any recovery project. Here, the insurers’ approach is generally more flexible than in property risks, but with noticeable differences between segments.
- Classic risks: The most stable segments are voluntary health insurance (VHI) (30% of companies have a broad appetite, another 26% – significant) and personal accident (PA) insurance (31% broad appetite). The market is ready to provide basic social protection for personnel. Life insurance looks the most conservative: 48% of surveyed companies currently have no appetite for this area in the context of investment projects, with broad appetite at only 24%.
- War risks: Health insurance proved to be the most adaptive: a total of 55.5% of insurers are ready to cover war risks (29.6% – broad appetite, 25.9% – significant), and only 7.4% completely refuse. Personal accident insurance is also accessible: 31% of companies have a broad appetite for covering war injuries, another 13.8% – significant. The most closed segment is life insurance: endowment programs with war risks are closed in 54.5% of companies, pension products – in 60%.
Per-person limits for war risks are significantly lower than for classic ones: for endowment life insurance – UAH 1 million versus 40 million, for personal accident insurance – UAH 1 million versus 20 million. Health insurance remains the most protected for corporate clients – the reinsurance limit for corporate VHI is determined individually and is practically unlimited (Infinity), allowing coverage for teams of up to 50,000 people. Another difference from property insurance is that percentage deductibles or their complete absence prevail in personal insurance for classic medical risks.
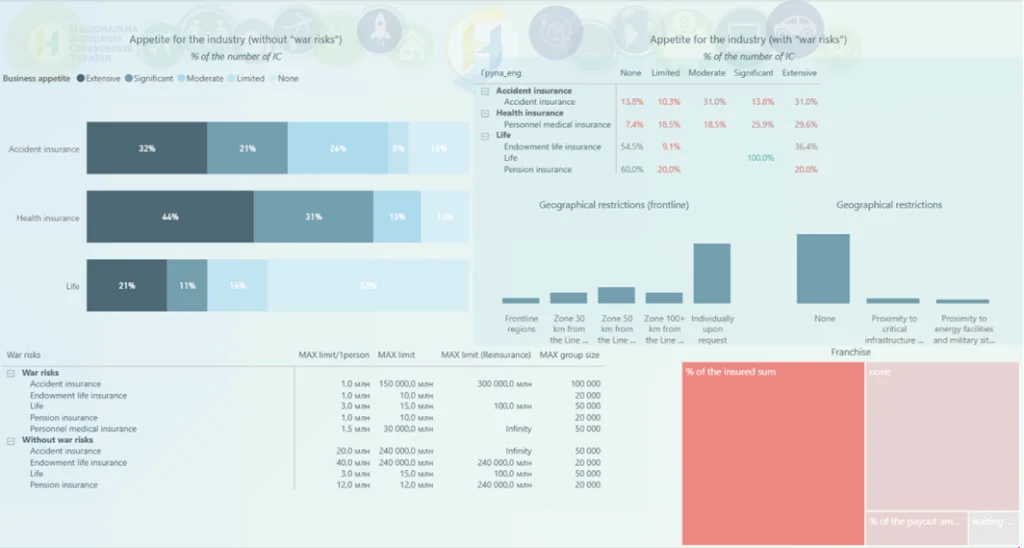
Fig. 3. Personal insurance analytical panel
Try It Yourself
Data transparency is the foundation of trust in the financial sector. Successful recovery requires not only capital but also a precise understanding of where the boundaries of insurance coverage lie today.
We invite investors, businesses, and state institutions to independently explore market indicators on our open interactive dashboard. It turns complex arrays of statistics into a convenient navigator for informed decisions at every stage of the recovery.